TCSC weather
Latitude N 37° 05' 41" Longitude W 81° 47' 37" Elevation 2519 ft
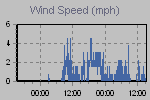
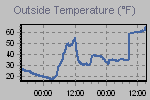
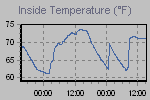
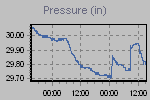
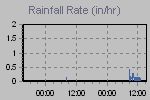
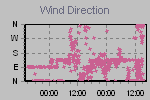
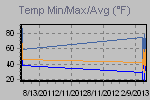
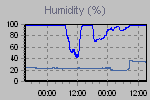
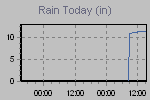
These graphs present the temperature, pressure, rainfall, and wind speed trends for the last 48 hours.
The thumbnail graphs are sampled every ten minutes. Click on a thumbnail to display the corresponding larger graph in the panel above it. The large graphs are sampled every minute.

| Click on a thumbnail to show a large graph in the panel above. | ||||
 |
 |
 |
 |
 |
 |
 |
 |
 |
 |
| :now::gauges::today::yesterday::this month::this year::records::monthly records::trends::forum: | ||||
Page updated 11/23/2013 11:46:18 AM
powered by
Cumulus v1.9.3 (1059)